 |
Analytical Control
Systems, Inc Analytical Control Systems, Inc. |
|
|
317-841-0458
317-841-3186
Analytical Control Systems, Inc.
|
In-Sure™ Information
Clinical Laboratory Quality Assurance In-Sure™: An Overview Analytical Control Systems, Inc. has developed a quality assurance program which helps customers meet regulatory requirements.
The Analytical Control Systems, Inc. In-Sure™ Quality Assurance Program is designed to provide the user with a simple, easy to use, control-data handling system. The In-Sure™ Levy Jennings data input chart allows the user to note the control value, the date and the position for each control, and adheres to the regulatory philosophy that if it is not written down, it was not done. At the end of the control period (reports should be in by the 15th of the month), a copy of the data input chart is forwarded to Analytical Control Systems, Inc. for processing. A report, including both individual and group means, standard deviations, and coefficients of variation, is returned. Youden plots as well as permanent, computer generated Levy Jennings plots of the submitted data are also supplied.
Components of Clinical Laboratory Assurance In-Sure™: Test Variables The In-Sure™ program was designed with the basic components of good quality assurance in mind.
T he primary objective of a clinical laboratory quality assurance program is to insure that no test variable exceeds acceptable limits and causes a clinically significant error in test results. To achieve this objective, a good quality assurance program contains several components. The basic components include the following:
Control Materials In-Sure™: Quality Controls and Quality Assurance In-Sure™ helps laboratories define what a quality control should and should not do.
C ontrol values should be in the normal, elevated, and therapeutic range of the test constituent. The control required and the range of values are determined on a test by test basis. The base matrix of the control is not of significance as long as the control is sensitive to the variables in the test system which have an impact on patient results. Recently, due to concern over blood borne pathogens, there is a trend toward the use of non-human (animal) based controls. In most cases, non-human matrix controls are quite sensitive and reliable.
Statistics and Interpretation In-Sure™: The Results Returned In-Sure™ returns useful statistical information and aids in interpretation of the results.
I n addition to identifying bias and out-of-control situations, a good quality assurance program will provide an assessment of both accuracy and precision of a testing system. Probably the best definition of accuracy and precision has been provided by the Expert Panel on Nomenclature and Principles of Quality Control in Clinical Chemistry of the International Federation of Clinical Chemistry. They define accuracy as: "... agreement between the best estimate of a quantity and its true value" and precision as "... agreement between replicate measurements."Three fundamental statistics are required to verify the integrity, precision and accuracy of a test system. These are the mean, which is a measure of accuracy, and the standard deviation plus the coefficient of variation, which are measures of precision. The principle of clinical significance has gained a great deal of popularity recently. This concept states that "... any deviation from an established mean must be viewed in terms of how clinically significant would this deviation be if the same deviation from the true value occurred in a patient's test result." The concept of clinical significance can be applied only by a physician. The laboratory must approach error detection utilizing statistical significance as the criteria for control data interpretation. Various rules for the interpretation of control data have been proposed. Each laboratory should establish their own interpretation guidelines. The components of a basic quality assurance program are as follows:
Analytical Control Systems, Inc., in support of our coagulation products, will assist your organization in developing a quality assurance program that provides all necessary functions, documentation and trouble shooting guidelines. The system, by being personalized for each facility, will be economical, efficient and ensure the integrity of the test systems. For those locations who have purchased a year's supply and need technical service, ACS will arrange an in-house training session (In-Service™).
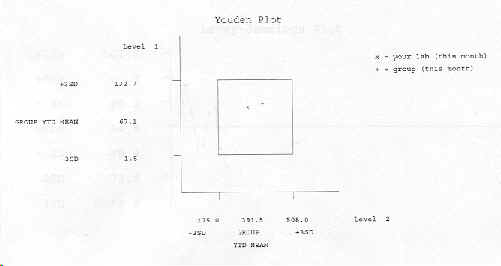
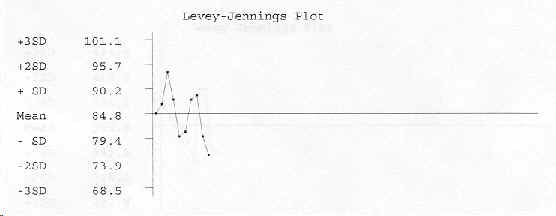
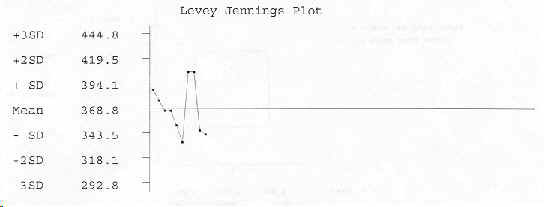
Example In-Sure Printout Statistical Reports Statistical evaluations of each customer who purchases a one year supply of quality controls that return quantitative results includes a Levey-Jennings Plot and a Youden Plot as well as a break down of individual values and the statistical data: mean, standard deviation (SD), coefficient of variation (CV) for the group and for each individual section. Example: Actual report may vary in looks. ACS Quality Control Program Statistical Report 11/05 Lab 00999 ACS 99Q Constituent 00200 ACTIVATED CLOTTING TIME Method 02003 HEMOTEC
Data Record Year 05 Month: 11 Lab 00999 ACS 99Q Constituent 00200 ACTIVATED CLOTTING TIME Method 02003 HEMOTEC Level 1 Data 10 Mean 84.8 SD 5.4 CV 6.4%
Data Record Year 05 Month: 11 Lab 00999 ACS 99Q Constituent 00200 ACTIVATED CLOTTING TIME Method 02003 HEMOTEC Level 2 Data 10 Mean 368.8 SD 25.3 CV 6.9%
| |||||||||||||||||||||||||||||||||||||||||||||||||||||||||||||||||||||||